Levente Szabo
M.S. Computer Science
New York University 2021
Email: levbszabo@gmail.com
View My LinkedIn Profile
Analysis of COVID Vaccine Sentiment Using Twitter
Joint Work: Dr. Annasse Bari, Ryan Cohen
Overview With multiple COVID vaccines in rapid development, we anticipate a variety of barriers regarding widespread vaccination. In order to gauge public perception regarding vaccination we construct a sentiment analysis system that analyzes Twitter data in real time. To facilitate healthcare professionals in overcoming vaccine hesitancy ours system gives insight into the reasoning behind specific attitudes as well as highlighting spatiotemporal differences
1. System Architecture
To gauge public sentiment regarding vaccination in real time our social media analytics pipeline shown below consists of a variety of platforms and primarily utilizes the Amazon Web Services (AWS) cloud infrastructure. In order to generate valuable insights from newly published Tweets our system takes data through 3 phases; an Ingestion, Analysis and Visualization phase. In addition to these aspects of our pipeline we also performed a data modelling phase by selecting key features, designing a database schema and bringing in external data sources.
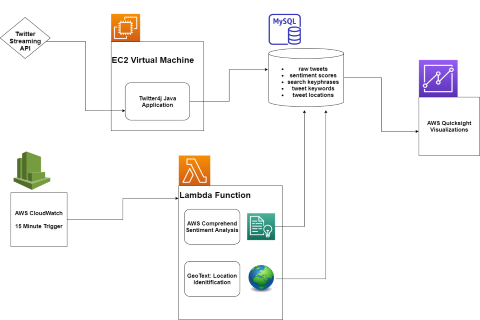
2. Data Ingestion
To collect real time tweets a Java application is used to interface with the Twitter Streaming API. We use Twitter4j to interface with Twitter and JDBC to interface with our MySQL relational database. To perform continuous tweet ingestion our application is run on an AWS Linux EC2 instance. In addition to tweets containing the word “vaccine” we also collect additional tweets that match a set of curated keywords. Finally tweets are stored in a MySQL relational database.
3. Data Analysis
English tweets are filtered and analyzed for positive, negative, neutral and mixed sentiment. On regular time intervals an AWS CloudWatch service initiates a serverless Lambda function to read unprocessed tweets from our MySQL database. Sentiment analysis and Keyword extraction are performed with AWS Comprehend and location matching using the Python geotext package.
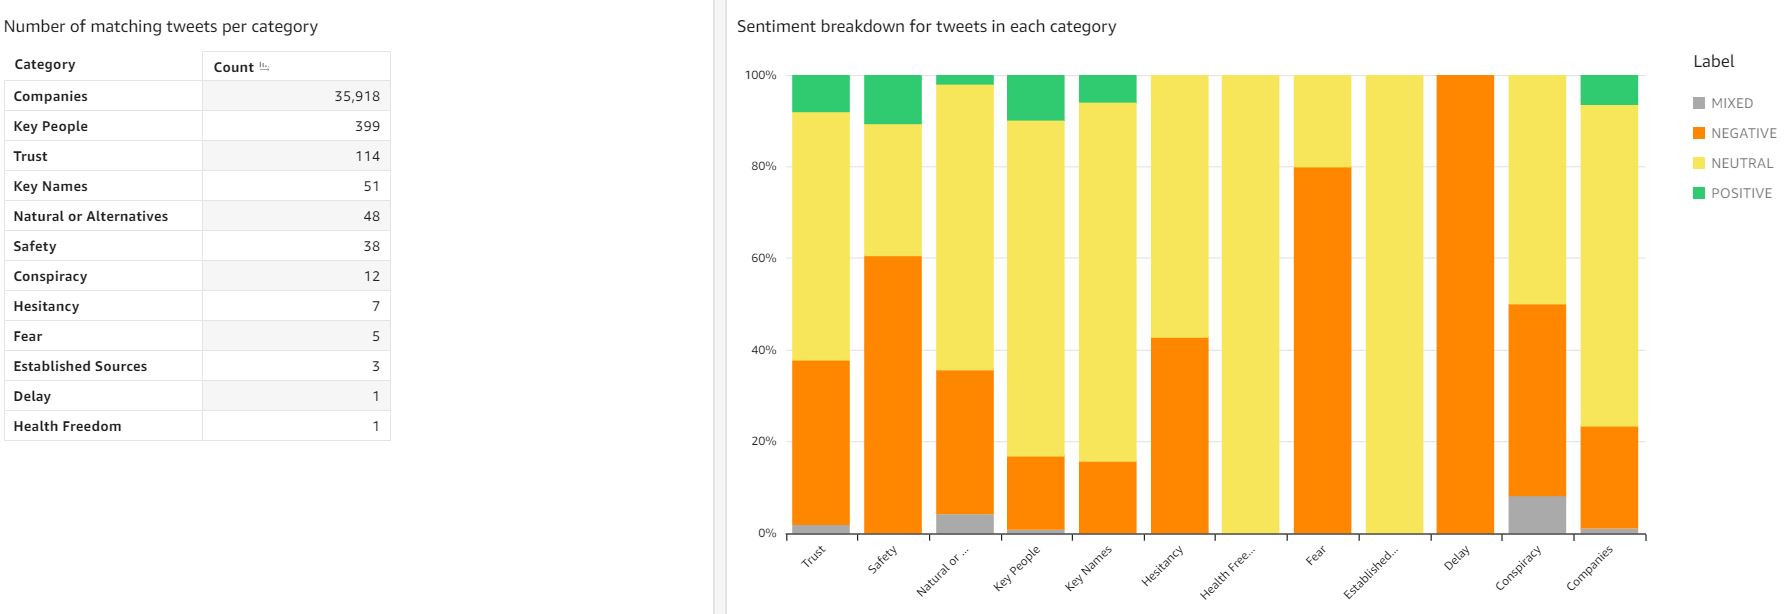
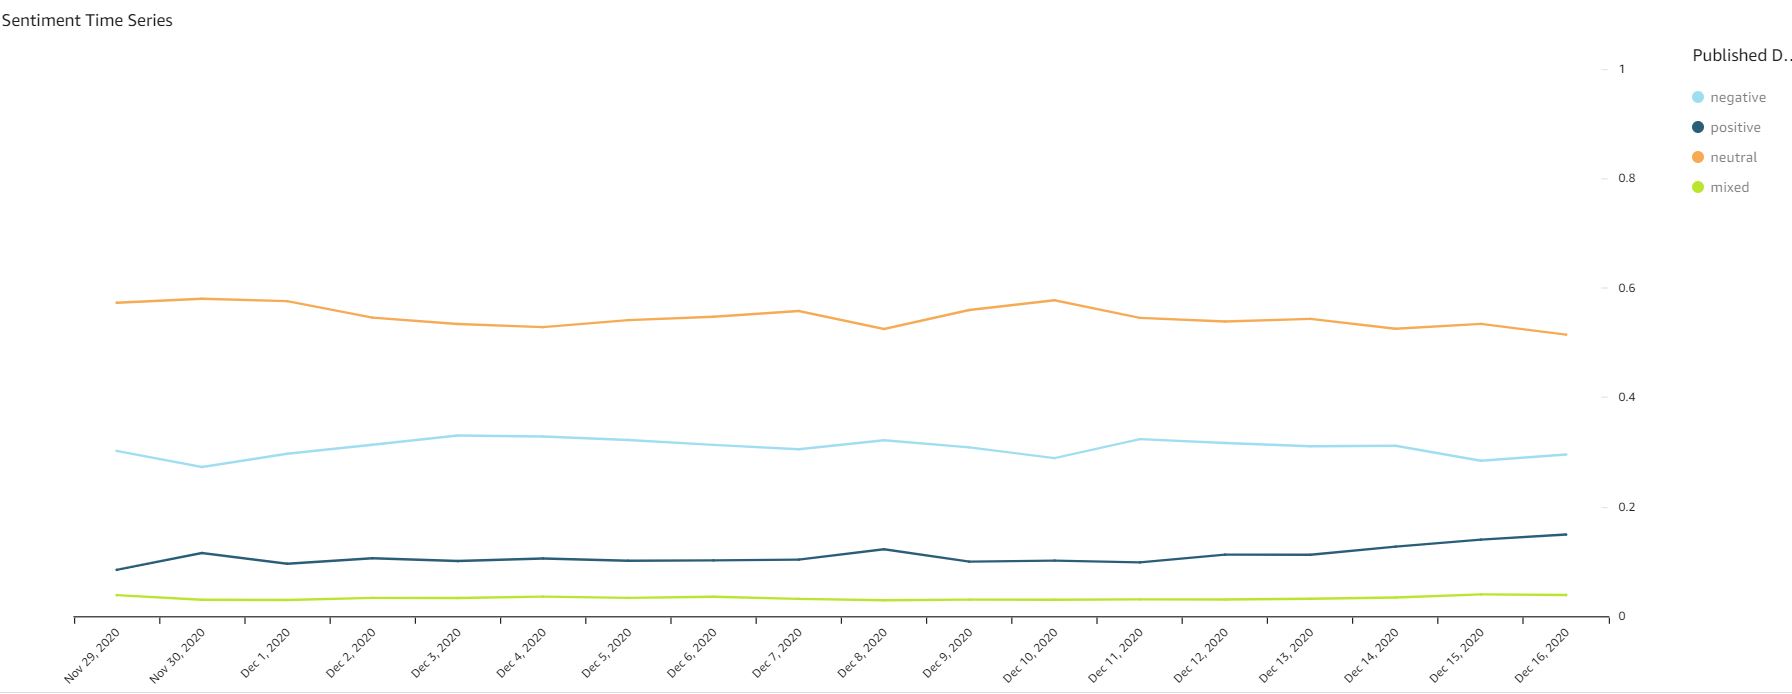
4. Data Visualization
Analytics regarding the breakdown of tweet sentiments, most common keywords and user locations is displayed as a dashboard using AWS QuickSight. Data is constantly refreshed to provide a real-time user experience. Below we have the sentiment breakdown across a variety of categories (Ex. Fear, Safety, Conspiracy). These results indicate the overall sentiment of specific topics in the Twitter space, we wish to use these as a stepping stone for future topic modelling approaches. Next we have the daily sentiment breakdown over the last 4 weeks, indicating any fluctuations in vaccine hesitancy.