Levente Szabo
M.S. Computer Science
New York University 2021
Email: levbszabo@gmail.com
View My LinkedIn Profile
US County Level COVID-19 Forecasting
Overview The new daily counts of COVID-19 across the most populous 1250 U.S. counties is predicted using a modified compartmental epidemiological model, denoted NNMRA-SEIR. Modifications to traditional compartmental models include localized measures of nearby outbreak severity through a nearest neighbor heuristic. The ability of NNMRA-SEIR to predict COVID-19 cases is shown to outperform a baseline SEIR model on a multi week prediction task. Further, NNMRA-SEIR indicates a tighter fit around the true infection curve compared to a baseline SEIR model.
1. Compartmental Epidemiological Modelling (SEIR)
Compartmental epidemiological models are an approach to modelling the spread of infectious diseases by separating the population into labeled compartments. In the case of an SEIR model these compartments are respectively Susceptible, Exposed, Infected and Recovered/Removed 1. The SEIR model is just one of the various compartmental models and it builds on the simpler SIR model which makes the simplification that susceptible individuals go directly to becoming infected upon exposure to the agent.

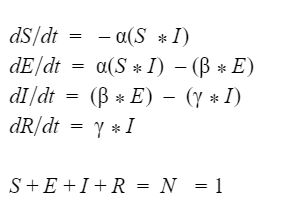
The diagram above indicates the compartments of the SEIR model, every arrow corresponds to a transition between the states governed by the following equations
2. Contributions (NNMAR)
We were able to improve on the predictive power of the baseline SEIR model by making adjustments to the difference equations concerning localized outbreak metrics. Fitting an SEIR model for a given county results in a predictive capacity that relies only on the time series infection data and ignores the physical proximity to epicenters. A county’s physical proximity to epicenters provides insight into the infection risk it faces. For this reason we devise Attack Rate denoted AR and nearest neighbor mean attack rate denoted NNMAR.
AR = TotalInfected / Population

NNMAR(d): Average(AR)*N(d)
Where N(d) indicates the neighborhood of counties within d units of longitude & latitude. For simplification we set d=1 with NNMAR referring to NNMAR(1). The NNMAR is used as a measure of localized infection and it is incorporated into the difference equations concerning the Exposed and Infected compartments.
3. Experimental Setup
Problem Statement: For the most populous 1250 US counties predict the number of new daily infections 3 weeks ahead using a NNMAR-modified SEIR model. Compare the RMSE fit of the modified SEIR model with a baseline SEIR model. Furthermore, compare the predicted new cases over the next 3 weeks with baseline SEIR.
Data: The primary dataset can be attributed to the NYTimes, COVID-19 Cases by US County are made available and updated daily 2. The county specific population data is provided by the US Census Bureau 3. The final dataframe was constructed by joining the base COVID-19 infection counts with US census bureau population data and Tableau generated longitude and latitude locations for each county.
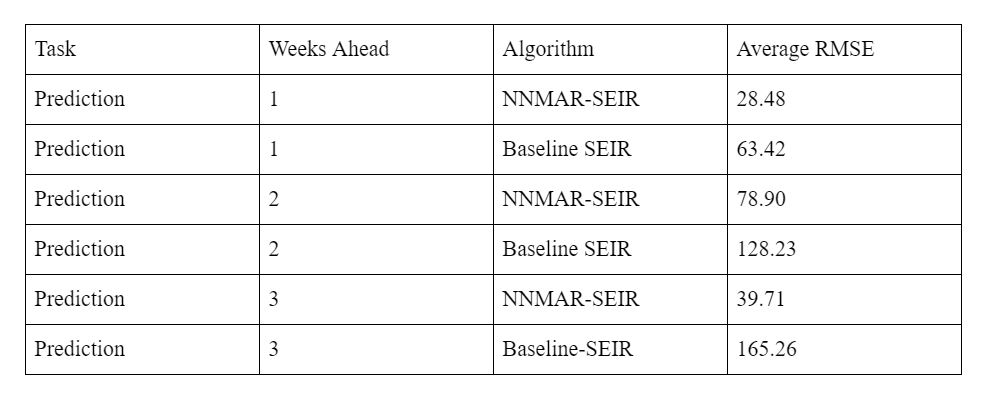
Results: To evaluate the model we tested it on a 3 week prediction task. We selected the top 1250 most populous counties. We took a NNMAR curve for each county after excluding the last 3 weeks of case counts. Then, for each county we calculated the RMSE between its 3 separate weekly predictions and the true confirmed case counts. Finally we took the average of these over all counties. This prediction task was done on both a baseline SEIR model and the NNMAR-SEIR model in order to compare results. The RMSE is shown for the two prediction tasks.
4. Forecasting
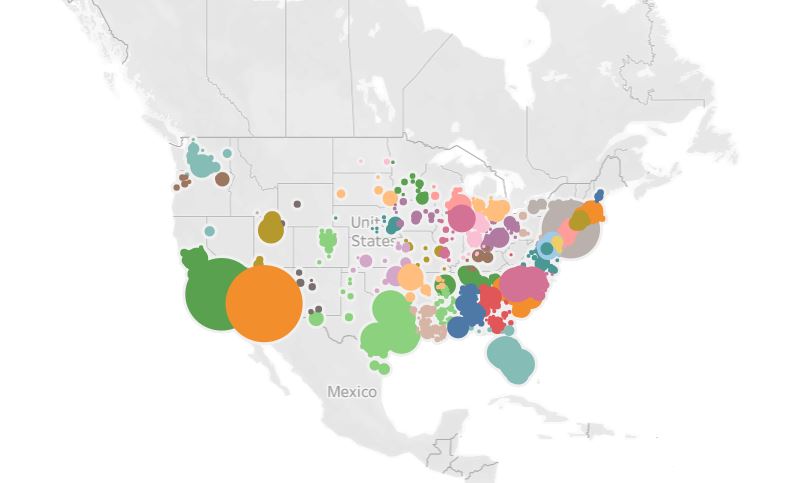
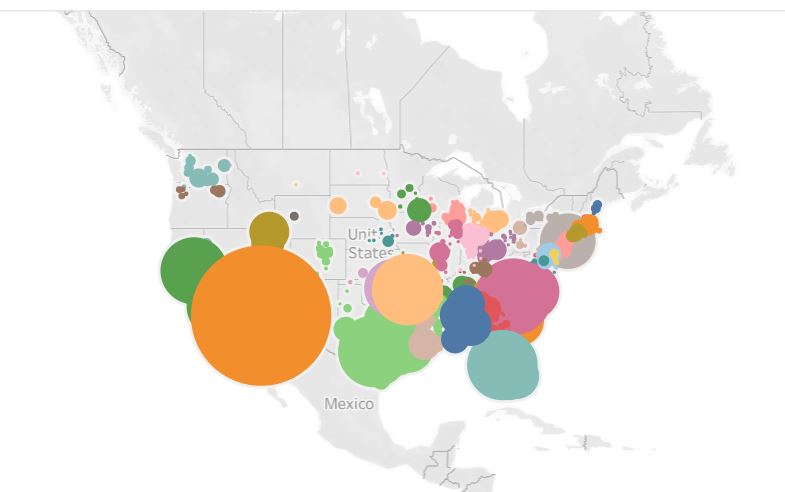
Finally we constructed a dashboard using Tableau to visualize the county level case numbers across the United States. The dashboard was constructed using data up to June 20th 2020 and provided forecasts over the 1250 most populous US-Counties up to August 10th 2020, below we display the dashboard for the two values respectively. The algorithm effectively predicts the surge in new COVID-19 cases across the southern and western regions of the United States which occured during Summer 2020.
Work was done as a project in the context of NYU Graduate Big Data and ML Systems Course
[1]: Vynnycky, E.; White, R. G., eds. (2010). An Introduction to Infectious Disease Modelling. Oxford: Oxford University Press.
[2]: The New York Times. (2020). Coronavirus (Covid-19) Data in the United States, from https://github.com/nytimes/covid-19-data.
[3]: US Census. County Population Totals: 2010-2019, from https://www.census.gov/data/datasets/time-series/demo/popest/2010s-counties-total.html